MacroSnaps28 July 2026
No. 23Almost no US layoffs were blamed on AI two years ago. In May it was the reason given for nearly 40% of them.
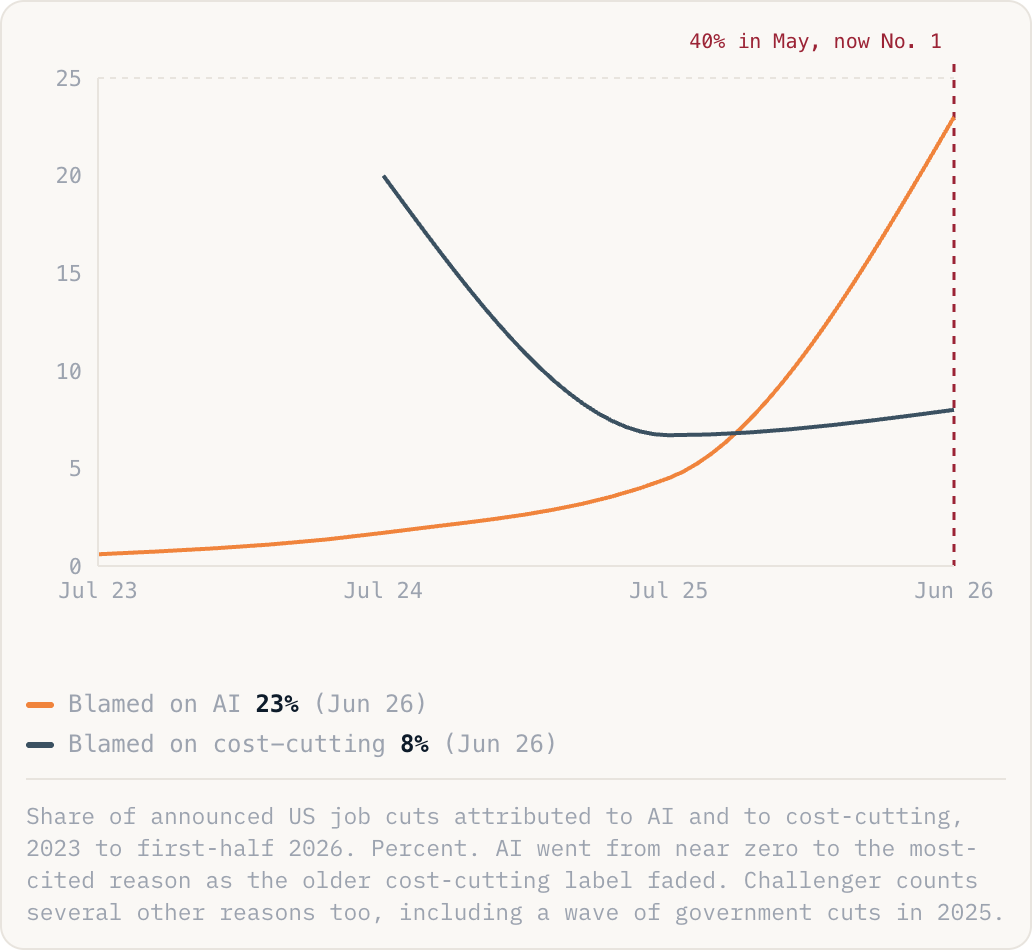
Blamed on AI23%(Jun 26)Blamed on cost-cutting8%(Jun 26)
Share of announced US job cuts attributed to AI and to cost-cutting, 2023 to first-half 2026. Percent. AI went from near zero to the most-cited reason as the older cost-cutting label faded. Challenger counts several other reasons too, including a wave of government cuts in 2025.
Why this is happening
- Some of it is real. Companies are automating support, coding and back-office work that used to need people.
- But the timing is suspicious. AI was blamed for under 1% of cuts as recently as 2024, then leapt to the top reason in 2026, faster than any technology actually replaces a workforce.
- And it is partly relabeling. As AI surged, the vaguer "technological update" reason and the old cost-cutting line both shrank. Calling a layoff AI makes it sound like strategy, not retreat.
The take
Whether AI is really doing the cutting or just the cover story, boards now have a way to make layoffs sound like progress rather than pain. They will keep reaching for it, so this line keeps climbing.