MacroSnaps19 August 2026
No. 39The US government is paying more to borrow for 30 years than at any time since 2004. Japan, which paid almost nothing ten years ago, is at a record.
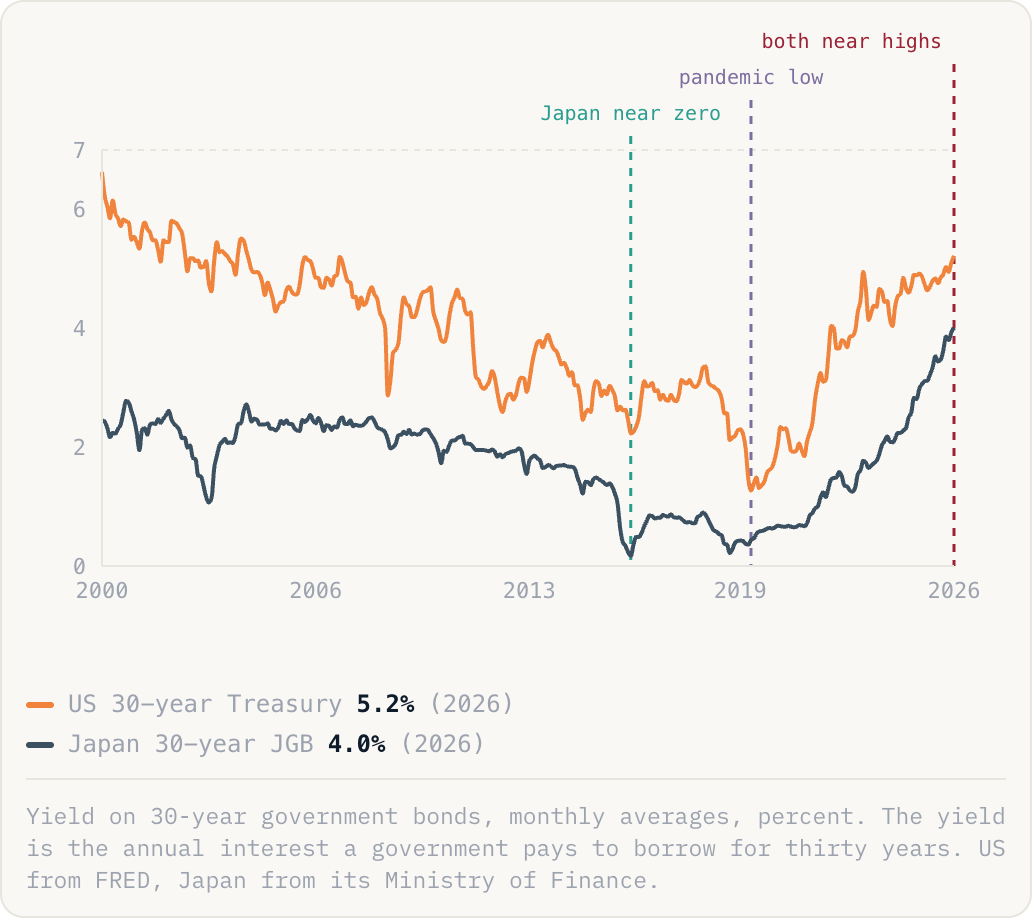
US 30-year Treasury5.2%(2026)Japan 30-year JGB4.0%(2026)
Yield on 30-year government bonds, monthly averages, percent. The yield is the annual interest a government pays to borrow for thirty years. US from FRED, Japan from its Ministry of Finance.
Why this is happening
- Long-term yields track what investors expect on inflation and on how much new debt is coming. Both expectations have risen: US federal debt is near $40 trillion, and governments are borrowing for defence, energy and the AI buildout.
- Japan is a special case. Its central bank held yields near zero for a decade by buying bonds itself, then began withdrawing in 2024. The 30-year rate has gone from 0.17% in 2016 to 4.01%, about 24 times higher.
- This is the price of borrowing, not a stock market move. It feeds through to mortgages and business loans, and it raises each government’s own interest bill, which adds to the borrowing that pushed the rate up.
The take
For most of the past twenty years, rich governments could borrow for a generation almost free, and built budgets on the assumption it would last. That era has now ended in both of the countries that leaned on it hardest. Japan is the sharper case: the country that invented free money for governments is paying more for it than at any point this century.