MacroSnaps22 July 2026
No. 17Six of every ten electric cars sold in the world are now bought in China.
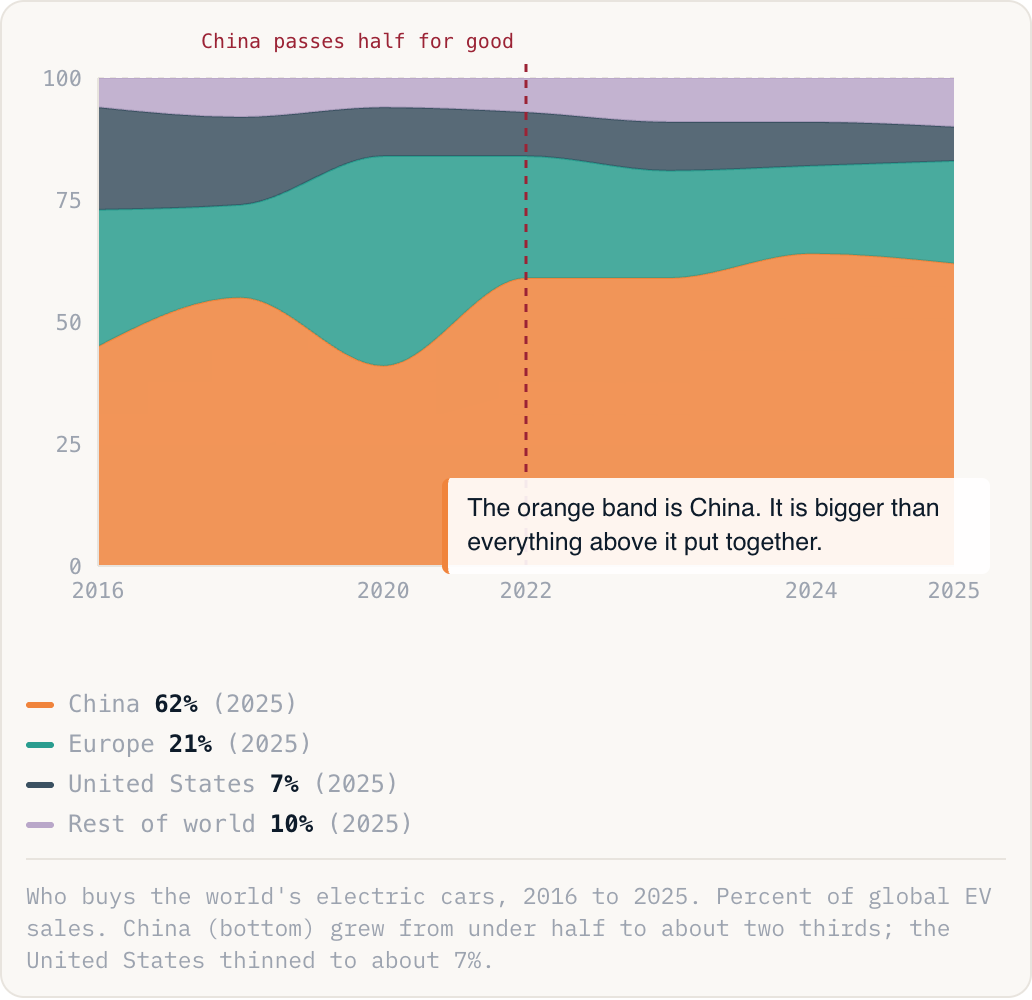
The orange band is China. It is bigger than everything above it put together.
China62%(2025)Europe21%(2025)United States7%(2025)Rest of world10%(2025)
Who buys the world's electric cars, 2016 to 2025. Percent of global EV sales. China (bottom) grew from under half to about two thirds; the United States thinned to about 7%.
Why this is happening
- China built the whole supply chain first. It refines most of the world's lithium and makes most of its batteries, so a Chinese EV is simply cheaper to build than a Western one.
- Then a price war among dozens of local makers, led by BYD, pushed EVs below the price of petrol cars. For a Chinese buyer, electric is now the cheaper choice, not the green one.
- Beijing backed all of it with charging networks, subsidies and city rules that favour electric.
- The others went the other way. Europe's emissions fines pushed it past China for a single year in 2020, and the US, whose federal tax credits ended in 2025, now buys fewer than one in ten of the world's EVs.
The take
Cars are the West's biggest manufacturing prize, and China just took the lead in the technology that replaces them, with the cheapest product and the supply chain to match. The new tariffs going up in the US and Europe are a sign of who is losing, not a fix for it.
Source: Rho Motion, IEA (2026)