MacroSnaps20 July 2026
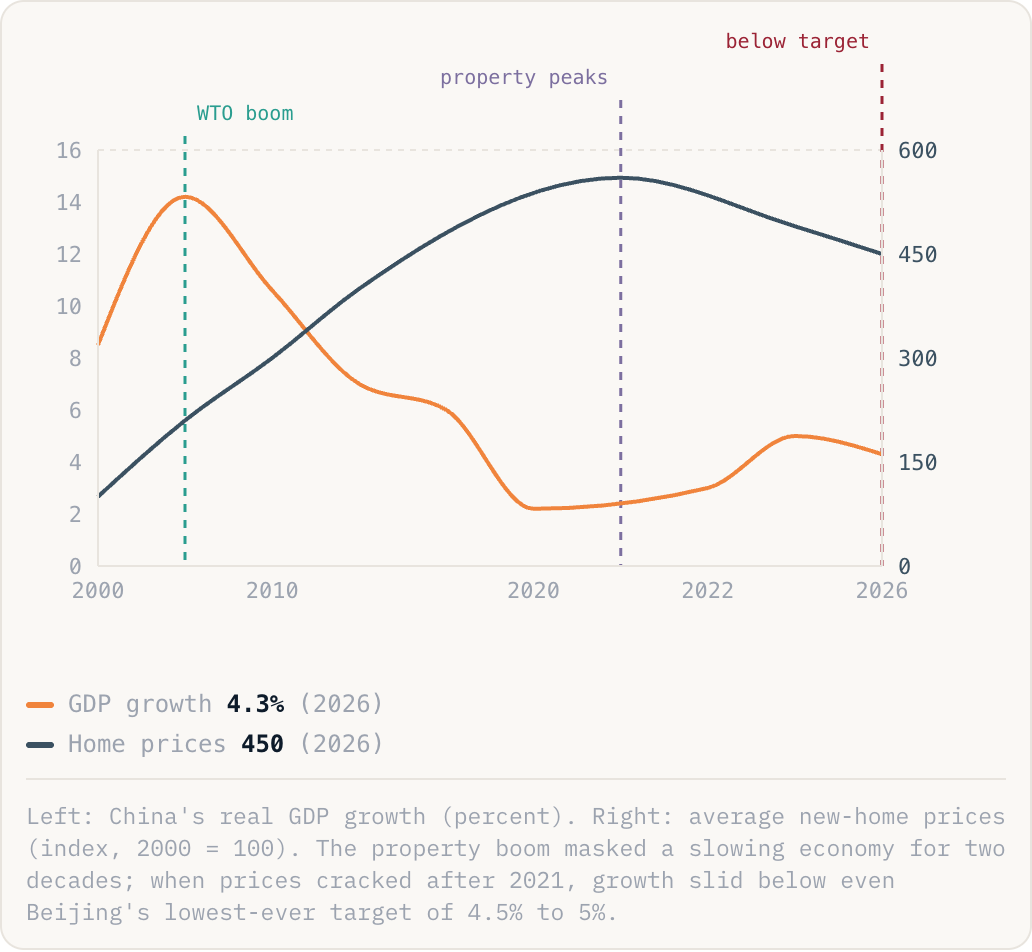
No. 15China's growth has slid from 14% to just over 4%, missing even its lowest-ever target.
GDP growth4.3%(2026)Home prices450(2026)
Left: China's real GDP growth (percent). Right: average new-home prices (index, 2000 = 100). The property boom masked a slowing economy for two decades; when prices cracked after 2021, growth slid below even Beijing's lowest-ever target of 4.5% to 5%.
Why this is happening
- Property is the heart of it: real estate and its related industries were about a quarter of the economy, and five years into a housing crash, sales, prices and building are all still falling.
- That wrecked confidence. Chinese families hold much of their savings in flats, so as prices drop they save rather than spend, and the country is now in a fourth year of deflation.
- For the first time in thirty years, investment in housing, factories and infrastructure fell. Exports are booming, electric cars and AI hardware up about 18%, but that cannot make up for weak demand at home.
The take
The model that lifted 800 million people out of poverty, building roads, flats and factories on borrowed money, has run out of road. The task now is to get Chinese households spending, and a country that saved and built its way up finds consumption far harder to engineer. When the world's second engine downshifts, everyone who sells to China feels it.
Source: World Bank, China NBS (2026)