MacroSnaps30 October 2026
No. 111Pick two Americans at random and there is a 53% chance they come from different ethnic groups. In Britain it is 40%, in Germany 19% and in Norway 15%.
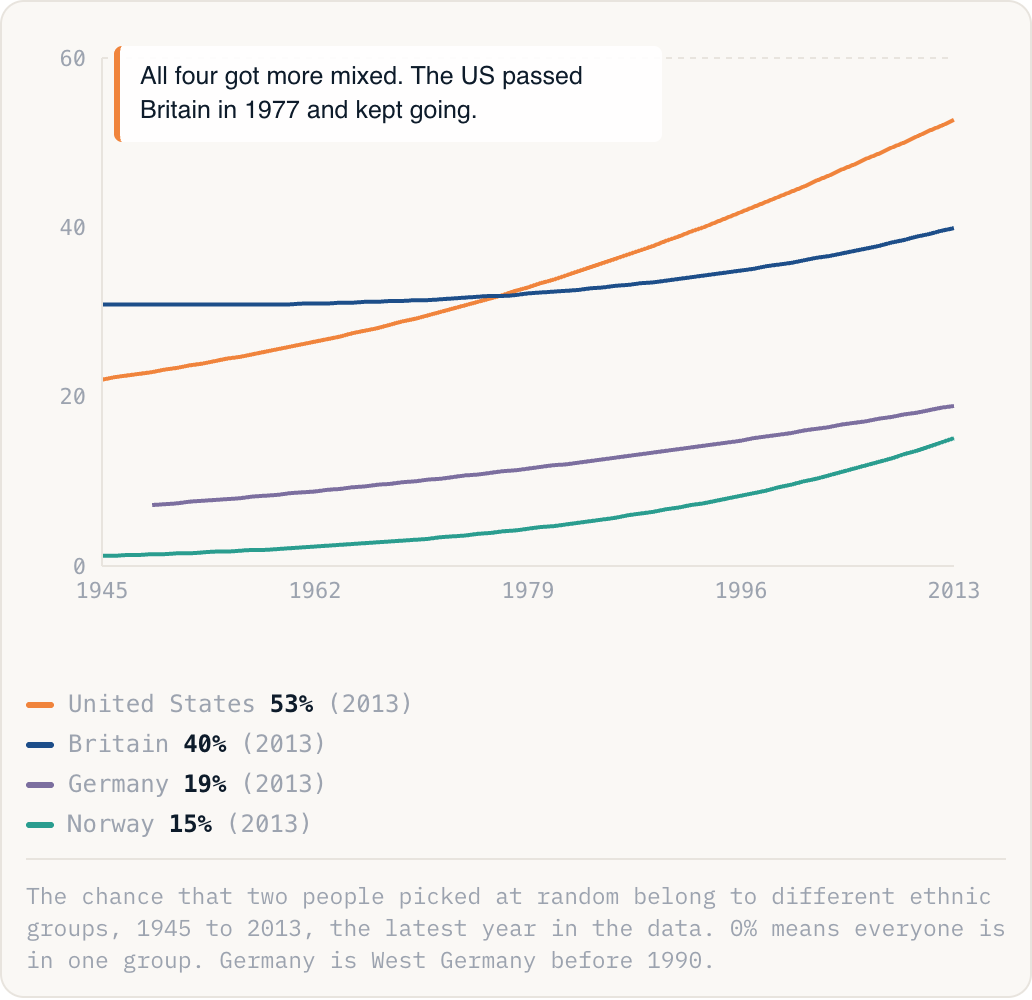
All four got more mixed. The US passed Britain in 1977 and kept going.
United States53%(2013)Britain40%(2013)Germany19%(2013)Norway15%(2013)
The chance that two people picked at random belong to different ethnic groups, 1945 to 2013, the latest year in the data. 0% means everyone is in one group. Germany is West Germany before 1990.
Why this is happening
- What the number means. Researchers split each population into groups and ask: if you pick two people at random, how likely are they to differ? In the US the groups are white, black, Hispanic, Asian and Native American.
- Why the US pulled ahead. After 1965 most immigrants came from Latin America and Asia, not Europe. White Americans fell from 88% to 66% of the population. The Census Bureau's own version of the index reached 61% in 2020.
- Europe is catching up, and these figures understate it. Norway went from 1% to 15%. Germany counts groups by passport, so Germans of Turkish origin with German citizenship count as German.
- France is missing because French law has banned collecting statistics on race and ethnicity since 1978. The closest number: 10.7% of people living in France in 2023 were immigrants.
The take
The US has argued about race and immigration for its whole history. For much of Europe it is new: Norway was 99% Norwegian at the end of the war. Europe's big welfare states were built for populations that were almost all one group. Who they are for is now a central question in elections in Britain, Germany and Norway.