MacroSnaps15 August 2026
No. 35Two centuries ago about three in four people lived in extreme poverty; now fewer than one in ten do.
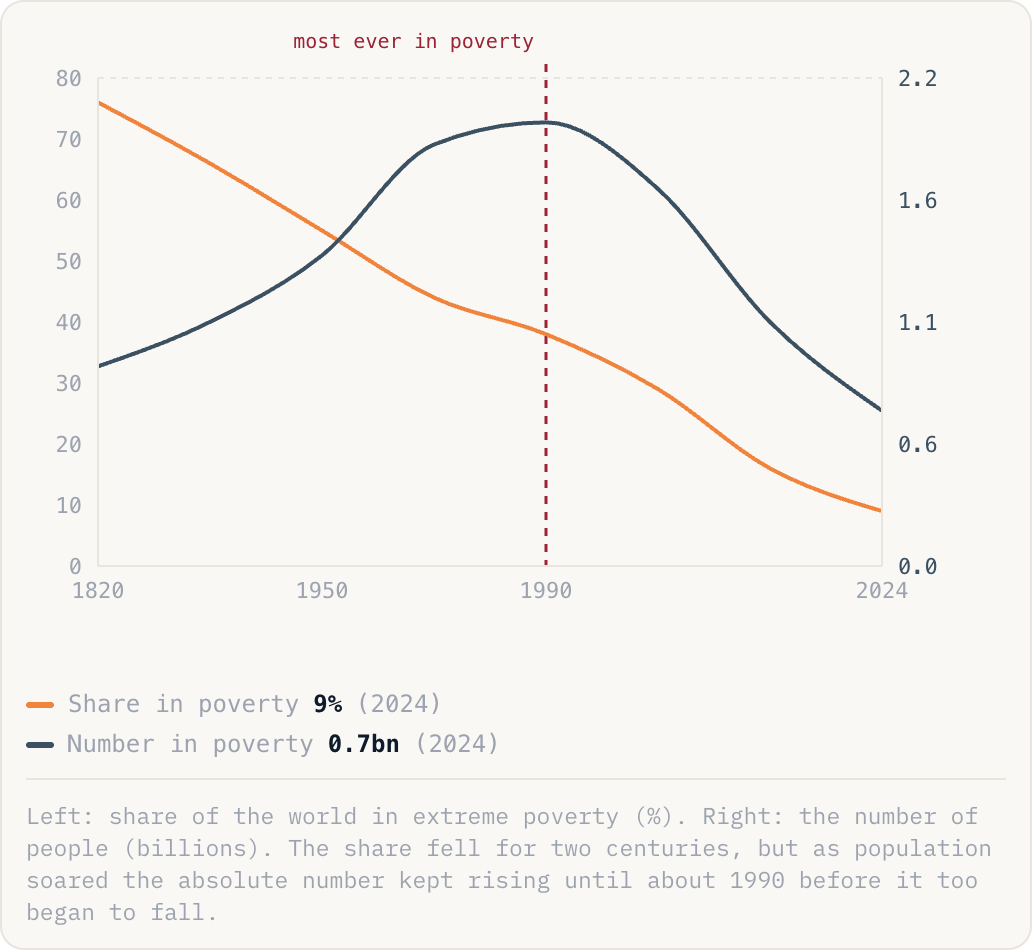
Share in poverty9%(2024)Number in poverty0.7bn(2024)
Left: share of the world in extreme poverty (%). Right: the number of people (billions). The share fell for two centuries, but as population soared the absolute number kept rising until about 1990 before it too began to fall.
Why this is happening
- Sustained economic growth, first in the West and then across Asia, lifted incomes faster than population rose.
- China and India alone moved well over a billion people above the line as they opened to trade and industry.
- Falling food prices, vaccines and basic infrastructure cut the death and destitution that kept families poor.
The take
The greatest fall in human misery in history, driven by growth in Asia. It happened while most headlines insisted the world was getting worse.
Source: World Bank, Our World in Data