MacroSnaps5 August 2026
No. 25Almost two-thirds of the world's stock market is American, though the US is only about a quarter of the world economy.
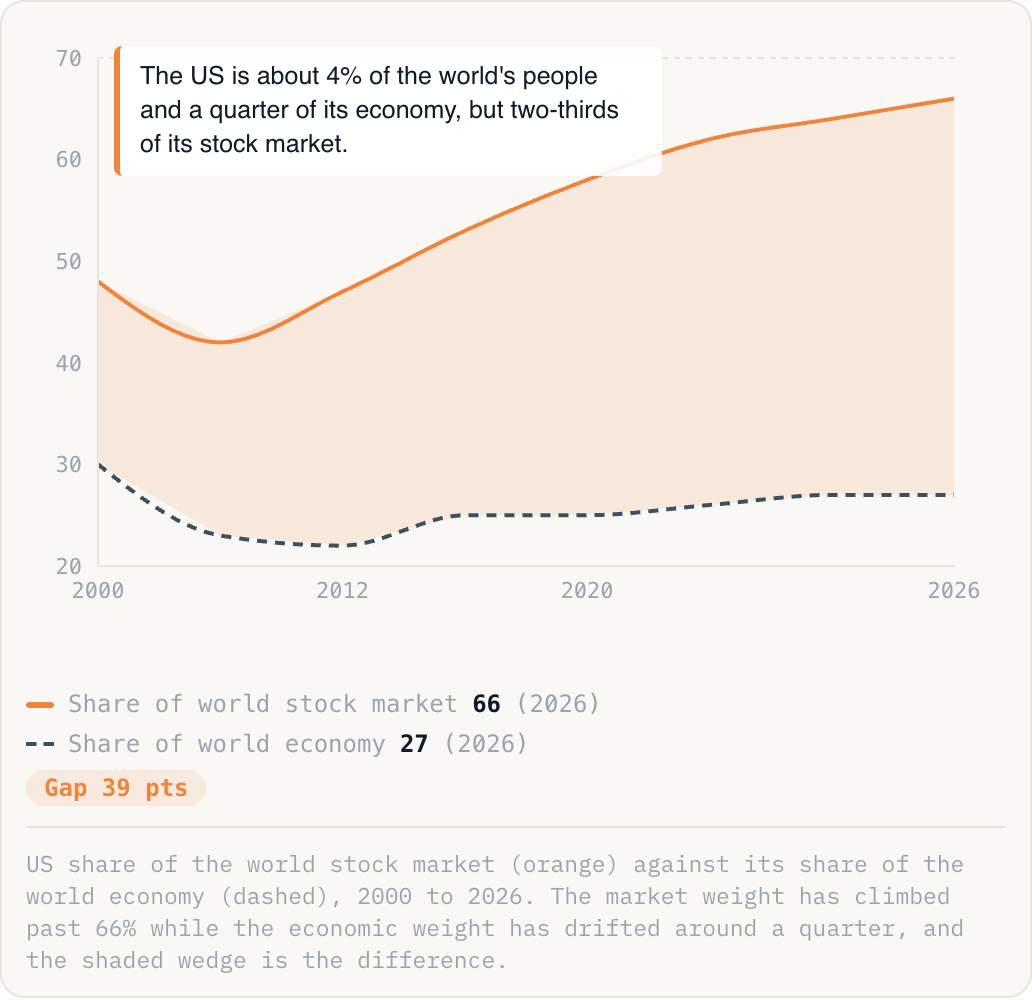
The US is about 4% of the world's people and a quarter of its economy, but two-thirds of its stock market.
Share of world stock market66(2026)Share of world economy27(2026)Gap 39 pts
US share of the world stock market (orange) against its share of the world economy (dashed), 2000 to 2026. The market weight has climbed past 66% while the economic weight has drifted around a quarter, and the shaded wedge is the difference.
Why this is happening
- America has nearly all of the giant tech winners, and those few names have soared while the rest of the world drifted.
- Global investors index by size, so the more US stocks rise, the bigger their slice of every world fund becomes.
- Deep markets and the dollar keep pulling in the world's savings, which lifts US prices further, well past what the economy alone would justify.
The take
If you own a "global" index fund, you mostly own America. The whole planet's savings are riding on a few hundred US companies, priced far above their share of world output, which is either the safest trade on earth or the most crowded one.
Source: MSCI, exchange data, IMF (2026)