MacroSnaps2 July 2026
No. 02The world's central banks now hold more gold than US Treasuries for the first time since 1996.
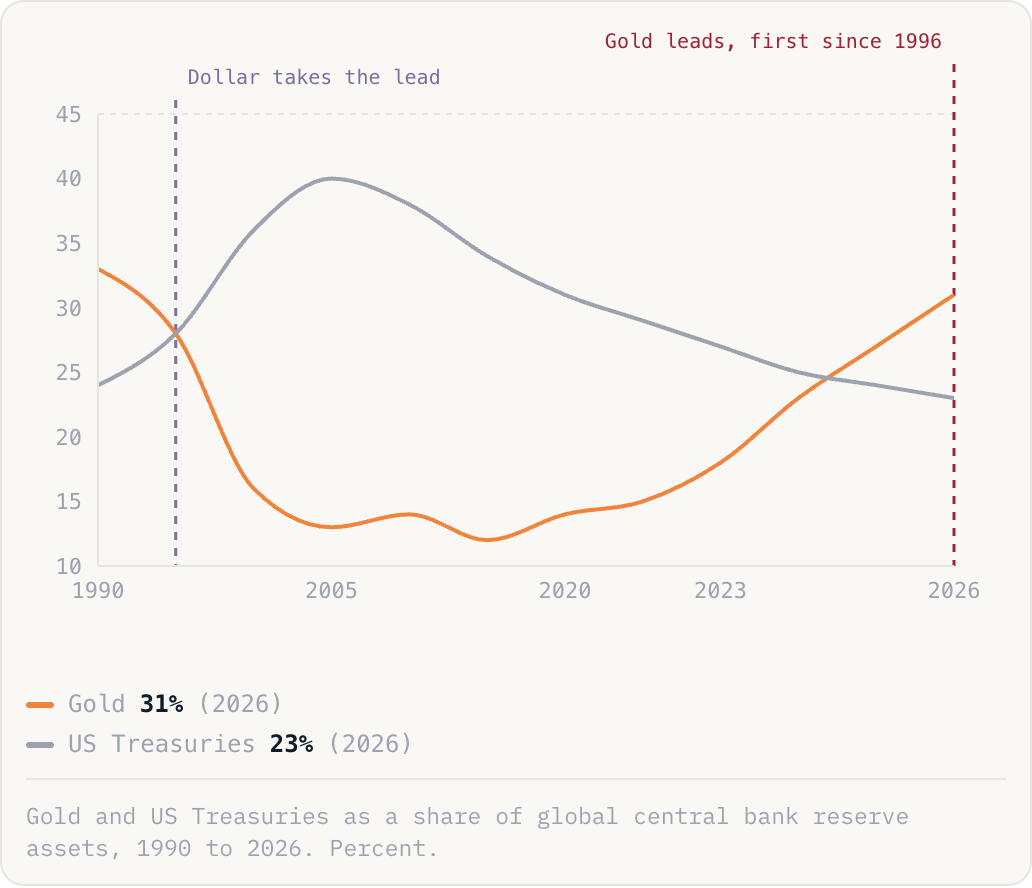
Gold31%(2026)US Treasuries23%(2026)
Gold and US Treasuries as a share of global central bank reserve assets, 1990 to 2026. Percent.
Why this is happening
- Treasuries peaked in the mid-2000s because China and the oil exporters ran enormous trade surpluses and parked the dollars in US government debt. That flood is the grey hump, and it has now gone into reverse.
- After the US froze Russia's reserves in 2022, other central banks realised dollar holdings can be switched off by Washington, while gold is the one reserve no other country controls.
- So they have bought gold in record amounts and let their Treasury holdings run down. Gold's price then roughly doubled in a year, which lifts its share of reserves again on top of all the buying.
The take
Central banks built the dollar's dominance. When they quietly swap their dollars for gold, it says more about the next decade than the next quarter.
Source: Morgan Stanley, IMF (2026)