MacroSnaps1 July 2026
No. 01Ten companies are now 41% of the S&P 500, the most concentrated it has been since at least 1972.
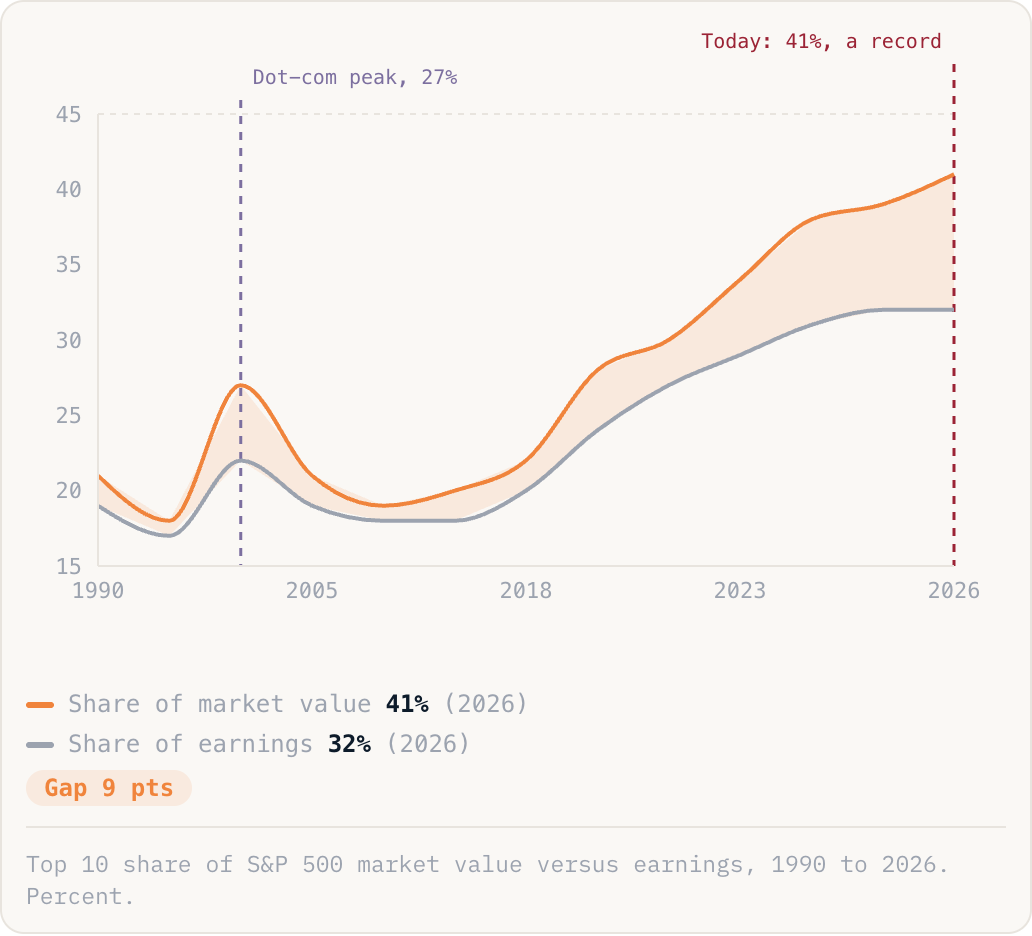
Share of market value41%(2026)Share of earnings32%(2026)Gap 9 pts
Top 10 share of S&P 500 market value versus earnings, 1990 to 2026. Percent.
Today's ten
NvidiaAppleMicrosoftAlphabetAmazonMetaBroadcomTeslaBerkshire HathawayJPMorgan Chase
A different ten entirely. In 1972 the giants were IBM, AT&T, GM and the like. Not one of them is in this list today.
Why this is happening
- AI turned a few megacaps into the only growth story investors fully trust, so money keeps crowding into the same handful of names.
- Most of the market is now index funds, and they buy strictly by size. Every new pension and 401k dollar pours into the biggest stocks first, which makes them bigger, which pulls in more money. The loop feeds itself.
- These giants are capital-light near-monopolies, so their profits, and the prices people pay for them, can run far ahead of the other 490.
The take
Buying the S&P 500 used to mean owning America. Now 41 cents of every dollar rides on ten mostly-AI names that earn barely a third of the profits.
Source: RBC Wealth Management, FactSet (year-end 2025)