MacroSnaps22 August 2026
No. 42Almost everything humans do stayed flat for centuries, then shot upward after 1950.
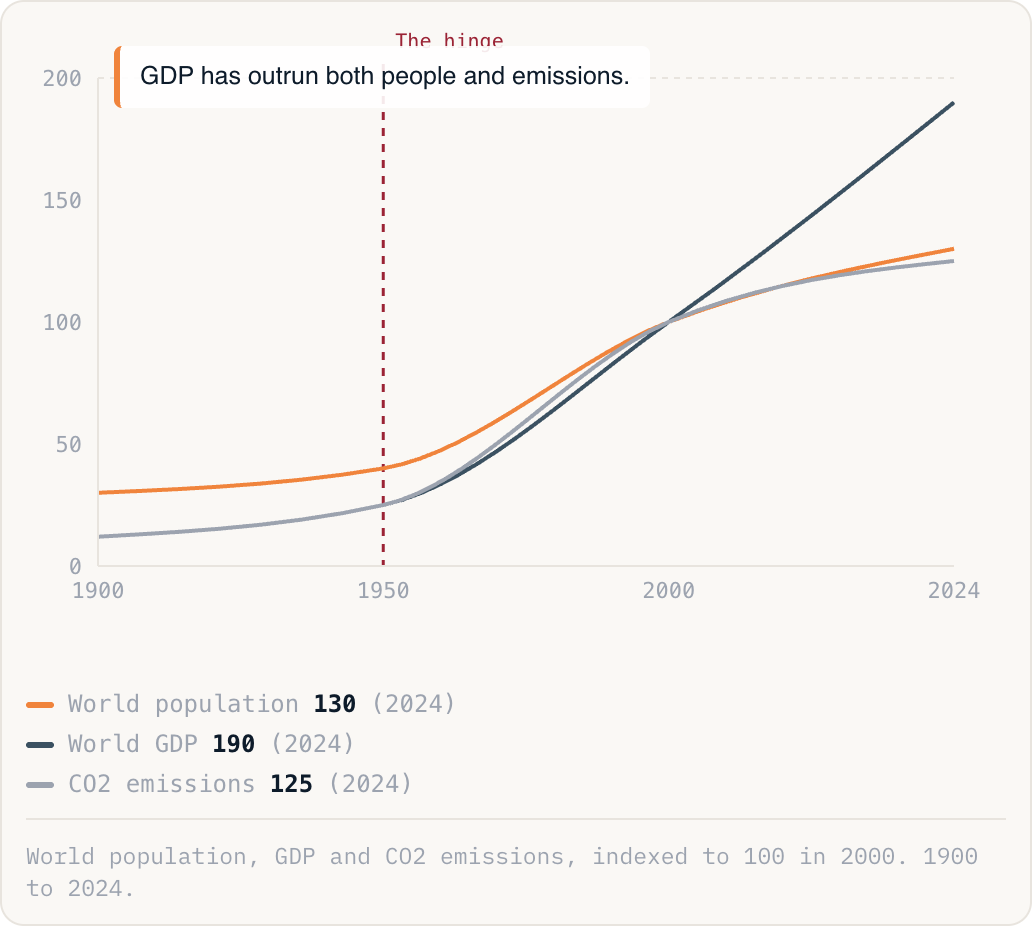
GDP has outrun both people and emissions.
World population130(2024)World GDP190(2024)CO2 emissions125(2024)
World population, GDP and CO2 emissions, indexed to 100 in 2000. 1900 to 2024.
Why this is happening
- Cheap fossil energy after the war powered factories, farms and transport at once, lifting output and emissions together.
- Medicine and food security cut death rates sharply, so population climbed faster than at any time before.
- Global trade and finance knitted economies together, compounding growth across the whole planet rather than a few countries.
The take
The mid-20th century is the hinge of the human story; we live inside the steep part of the curve. But look closer at the lines: GDP has outgrown both population and emissions, so the average person is far richer and each dollar of output now carries less carbon than before. Growth is, slowly, decoupling from both people and pollution.