MacroSnaps21 August 2026
No. 41US borrowing costs hit a 19-year high, so the Treasury started buying its own bonds back.
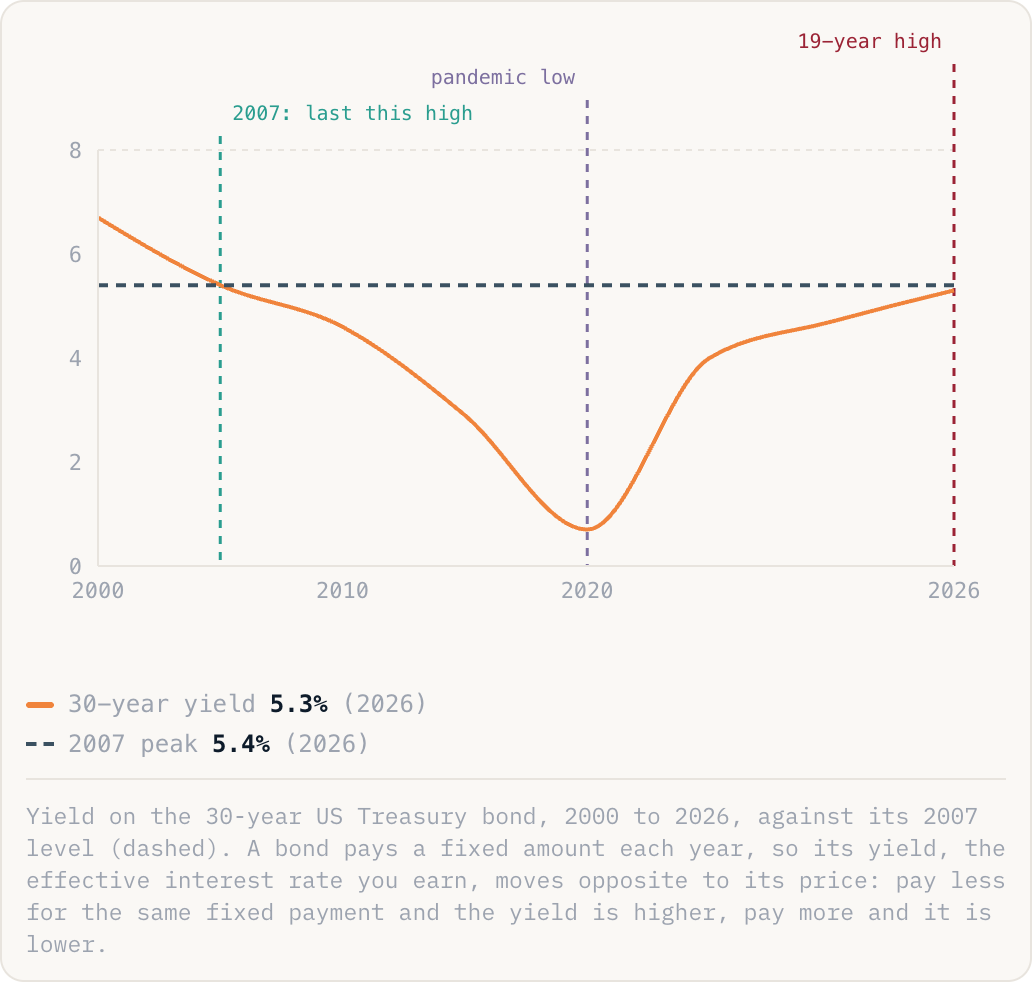
30-year yield5.3%(2026)2007 peak5.4%(2026)
Yield on the 30-year US Treasury bond, 2000 to 2026, against its 2007 level (dashed). A bond pays a fixed amount each year, so its yield, the effective interest rate you earn, moves opposite to its price: pay less for the same fixed payment and the yield is higher, pay more and it is lower.
Why this is happening
- The Treasury pays a fixed amount on every bond it has already sold, so a bond's yield depends on the price someone paid for it. When the Treasury buys some of those bonds back, the extra demand pushes their price up, and since that fixed payment is now a smaller share of a higher price, the yield, the percentage return, comes down.
- It stepped in because federal debt just passed $40 trillion, and the government has to keep selling new bonds to cover it. Every point yields rise makes that new borrowing pricier, piling a bigger interest bill on top of everything it already owes.
- The rally lasted about a day. Yields fell when the buyback plan was announced, then climbed right back the next day, because a few billion dollars in purchases is small change against a Treasury market worth tens of trillions.
The take
A government does not normally need to buy its own debt back to keep investors interested. Doing it now is itself the tell: Washington is nervous about how the market prices $40 trillion of IOUs. It bought a calmer headline for a day. It did not buy a smaller deficit.