MacroSnaps22 October 2026
No. 103America, Britain, Germany and France all build less than half as many new homes per person as they did in the early 1970s.
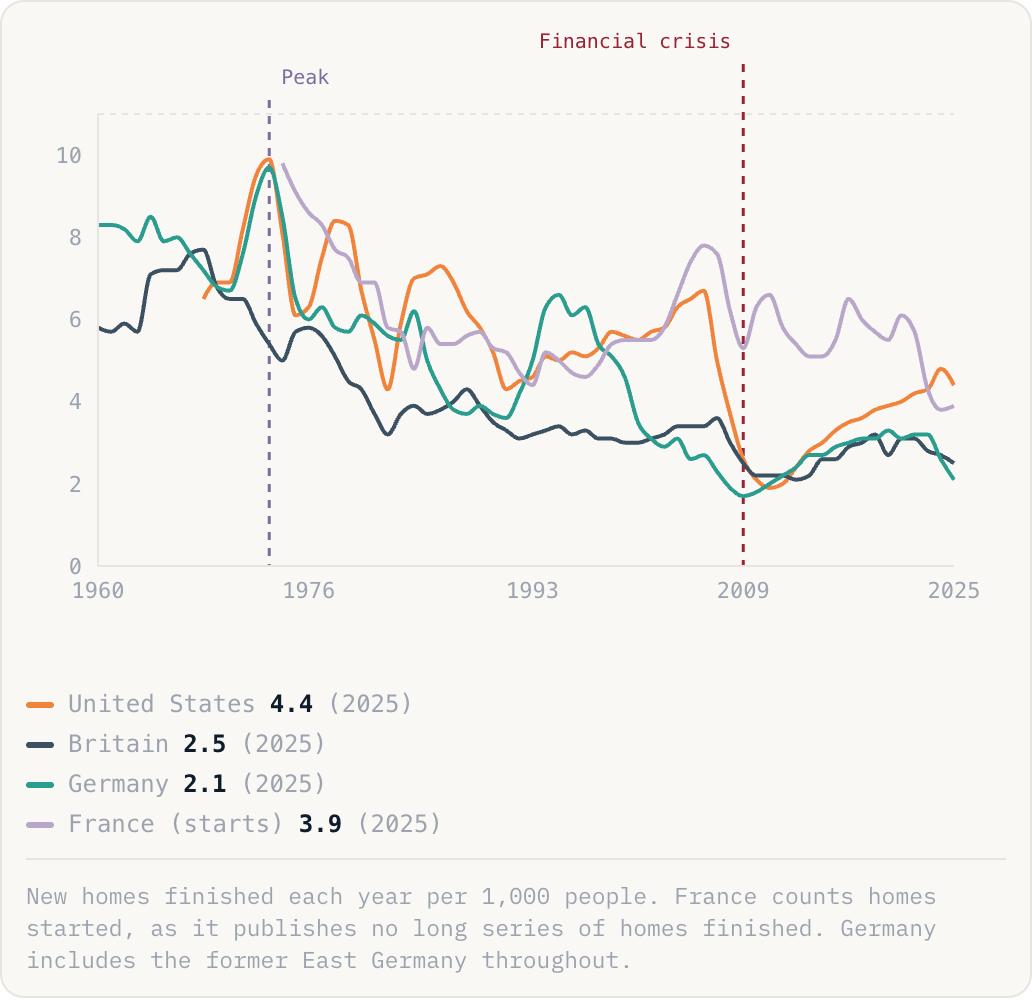
United States4.4(2025)Britain2.5(2025)Germany2.1(2025)France (starts)3.9(2025)
New homes finished each year per 1,000 people. France counts homes started, as it publishes no long series of homes finished. Germany includes the former East Germany throughout.
Why this is happening
- The 1970s peak followed decades of rebuilding after the war and fast-growing populations. Governments built directly: in 1968 almost half of Britain's new homes were council houses. Most of that public building stopped in the 1980s.
- The 2008 crash cut building everywhere at once. America has since recovered about half the lost ground. Britain and Germany never really recovered, and Germany and France have fallen again since 2022 as interest rates rose.
- Per person is one honest measure, not the only one. New homes today are bigger than in the 1970s, and more people live alone, so each home houses fewer people.
The take
When a country builds fewer homes than its people need, the shortfall shows up as higher prices and rents, not as empty plots. That is why housing costs are a political fight in all four countries at once. The British government wants 1.5 million new homes in England by 2029, about 300,000 a year. The whole of the UK finished 171,520 in 2025. America, often blamed for its housing shortage, now builds more per person than any of the other three.