MacroSnaps23 October 2026
No. 104Panama spent $5bn widening its canal. The biggest container ships still do not fit.
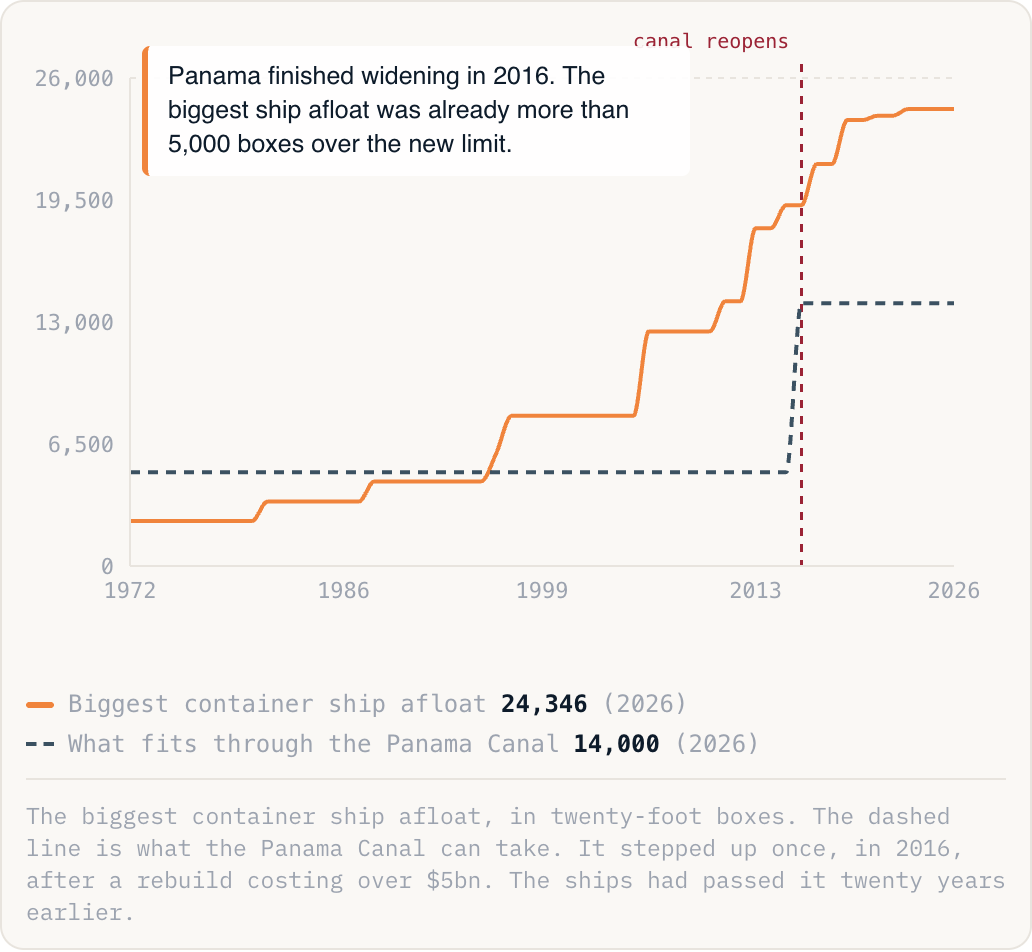
Panama finished widening in 2016. The biggest ship afloat was already more than 5,000 boxes over the new limit.
Biggest container ship afloat24,346(2026)What fits through the Panama Canal14,000(2026)
The biggest container ship afloat, in twenty-foot boxes. The dashed line is what the Panama Canal can take. It stepped up once, in 2016, after a rebuild costing over $5bn. The ships had passed it twenty years earlier.
Why this is happening
- The first ship built too wide for Panama on purpose came in 1988: APL's President Truman, fourteen containers across instead of thirteen. Its Pacific route never needed the canal, and the extra space paid for itself.
- Bigger ships are cheaper per container. A crew of about twenty runs a ship whatever its size, and the fuel needed for each container falls as ships get bigger.
- Ships this big have one route between Asia and Europe, the Suez Canal, and none through Panama. When the Red Sea became too dangerous in 2024 they sailed round Africa instead.
The take
Ships grew faster than the canals and ports built for them. Panama rebuilt and the biggest ships had already outgrown it. The record has not moved since 2023, because the limit now is the ports, cranes and channels that have to handle these ships. The trade-off: each container is cheaper to move, but fewer harbours and routes can take the ships that carry them.