MacroSnaps29 August 2026
No. 49Nobody is hiring. Nobody is firing. America's jobs market has frozen.
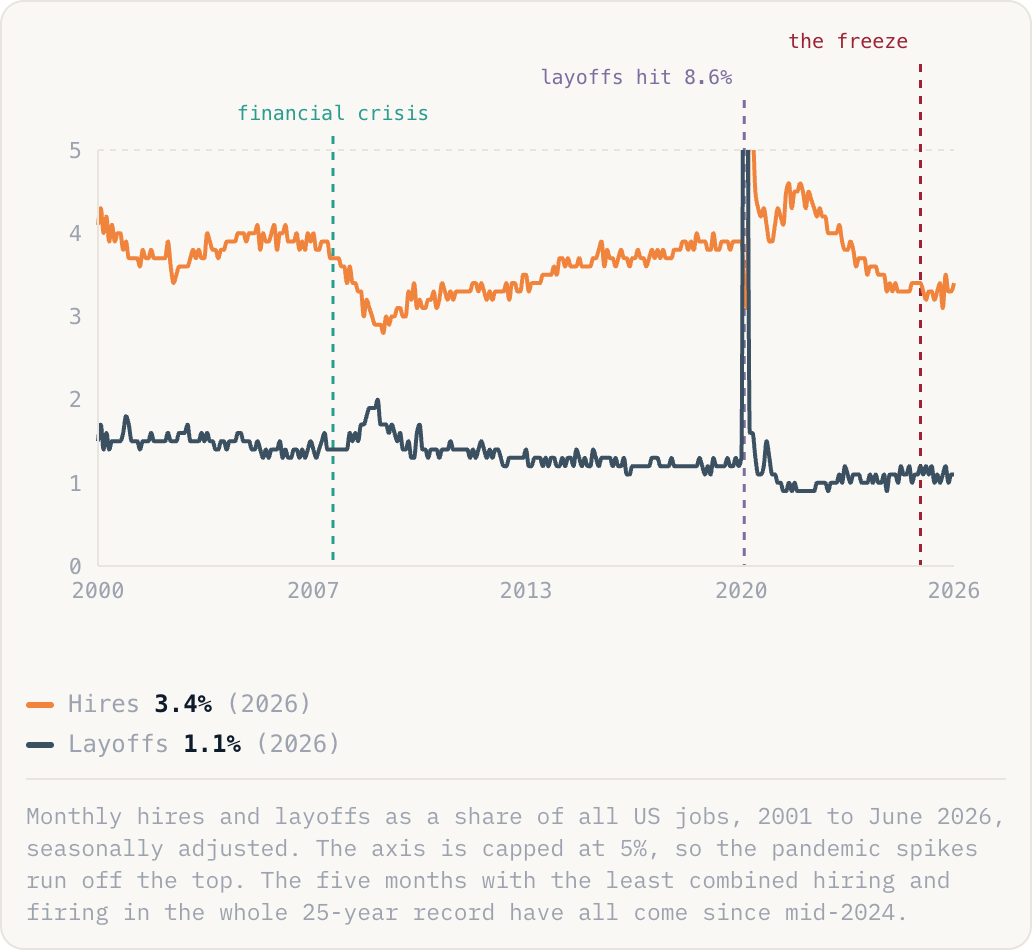
Hires3.4%(2026)Layoffs1.1%(2026)
Monthly hires and layoffs as a share of all US jobs, 2001 to June 2026, seasonally adjusted. The axis is capped at 5%, so the pandemic spikes run off the top. The five months with the least combined hiring and firing in the whole 25-year record have all come since mid-2024.
Why this is happening
- Employers are frozen by uncertainty: interest rates are still high, tariffs change month to month, and AI hangs over every headcount decision. But they also remember how hard rehiring was in 2021 and 2022, so instead of cutting staff they simply stopped adding any.
- Workers responded in kind. The share quitting each month is down by a third from the 2021 peak, because there is nowhere obvious to jump to; and every unfilled quit removes a vacancy for somebody else, so the whole ladder stops moving.
- The freeze hides in the headline numbers. Unemployment looks fine at 4.1% because layoffs are so rare, but the economy added only about 30,000 jobs a month over the past year, a fraction of the usual pace, and in July it actually lost 23,000.
The take
Economists call it low hire, low fire. For anyone in work it means safety without options: your job is safe, and your next one does not exist. That is how America can have 4% unemployment and one of the most miserable job hunts in memory at the same time, which is exactly what new graduates keep reporting. And a frozen market is a brittle one: if layoffs ever return to normal while hiring stays this weak, there is nothing underneath to catch the people who fall.