MacroSnaps30 August 2026
No. 50Gold has tripled since 2019. The S&P 500, with every dividend reinvested, is up 160%.
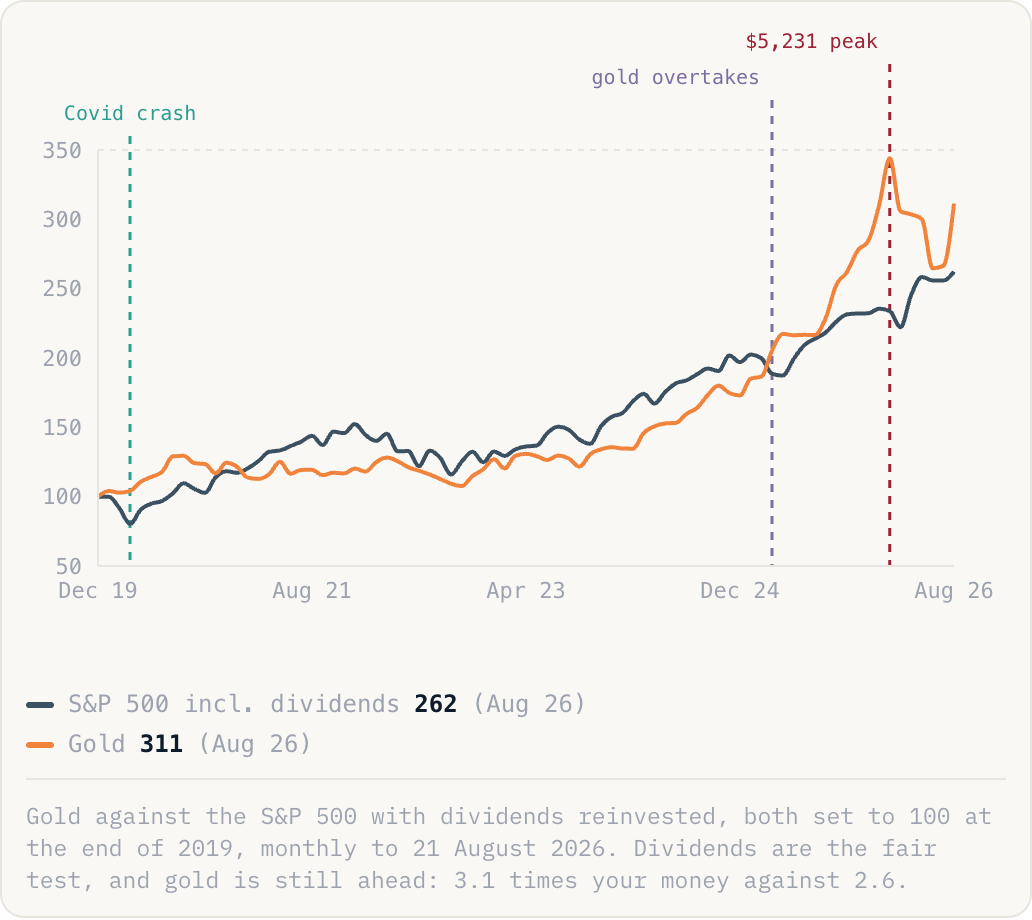
S&P 500 incl. dividends262(Aug 26)Gold311(Aug 26)
Gold against the S&P 500 with dividends reinvested, both set to 100 at the end of 2019, monthly to 21 August 2026. Dividends are the fair test, and gold is still ahead: 3.1 times your money against 2.6.
Why this is happening
- Central banks have bought gold at record pace since Russia's dollar reserves were frozen in 2022; a record 289 tonnes in the second quarter of 2026 alone. That bid does not care about price.
- The buyers share one worry: deficits running near 7% of GDP and political pressure on the Fed make dollars and bonds feel less safe. Gold pays nothing, but it owes nothing either.
- This is not a stock crash story. The S&P has handed investors 2.6 times their money since 2019; gold simply ran faster, as it last did when inflation and deficits ruled the 1970s.
The take
Gold tripling while stocks sit at records is new: in the 1970s gold needed a lost decade in shares to shine like this. So either the gold market is early to something the stock market cannot see, inflation, a debt reckoning, a weaker dollar, or one of the two is simply wrong. Both have been wrong before. They have rarely disagreed this loudly.