MacroSnaps31 August 2026
No. 51America's average tariff is 11%, the highest since the Second World War.
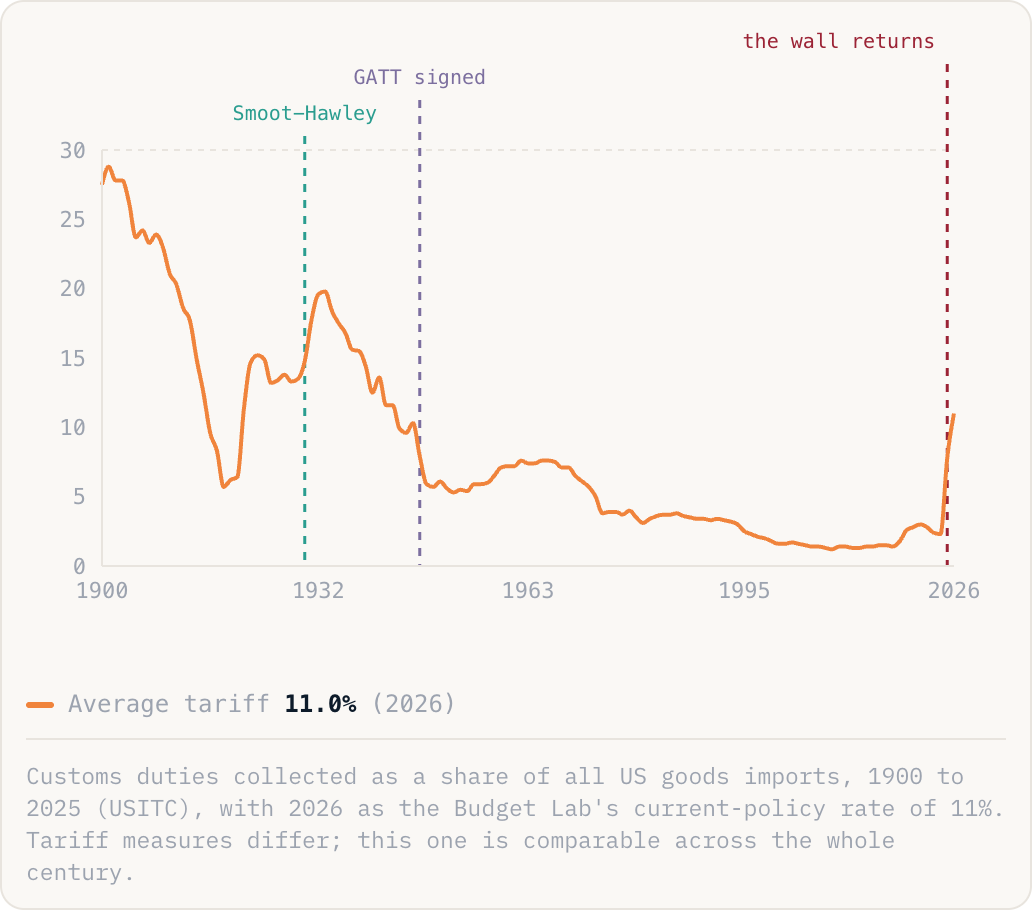
Average tariff11.0%(2026)
Customs duties collected as a share of all US goods imports, 1900 to 2025 (USITC), with 2026 as the Budget Lab's current-policy rate of 11%. Tariff measures differ; this one is comparable across the whole century.
Why this is happening
- Four rounds in two years rebuilt the wall: steel and aluminium, cars, country by country. This August alone: 50% on a range of Canadian goods, 25% on Brazil, 10 to 12.5% on sixty partners.
- It is bipartisan now. Biden kept nearly every Trump tariff on China, and the new wall raises real money, about $1.9 trillion over ten years, so nobody in Washington is campaigning to take it down.
- Importers pay the duty and pass it on. The Budget Lab puts the cost at about $1,100 per household a year, with consumer prices about 0.7% higher than they would otherwise be.
The take
Eighty years of trade opening have been unwound in two. When the wall last went up, in 1930, retaliation cut US exports by two thirds and deepened the Depression. This time most partners cut deals instead of retaliating, so the cost so far is a tax on buyers, not a trade collapse. And because the Treasury now counts on the revenue, the wall will likely outlast the president who built it.