MacroSnaps1 November 2026
No. 113More satellites went up in the last five years than in the previous sixty.
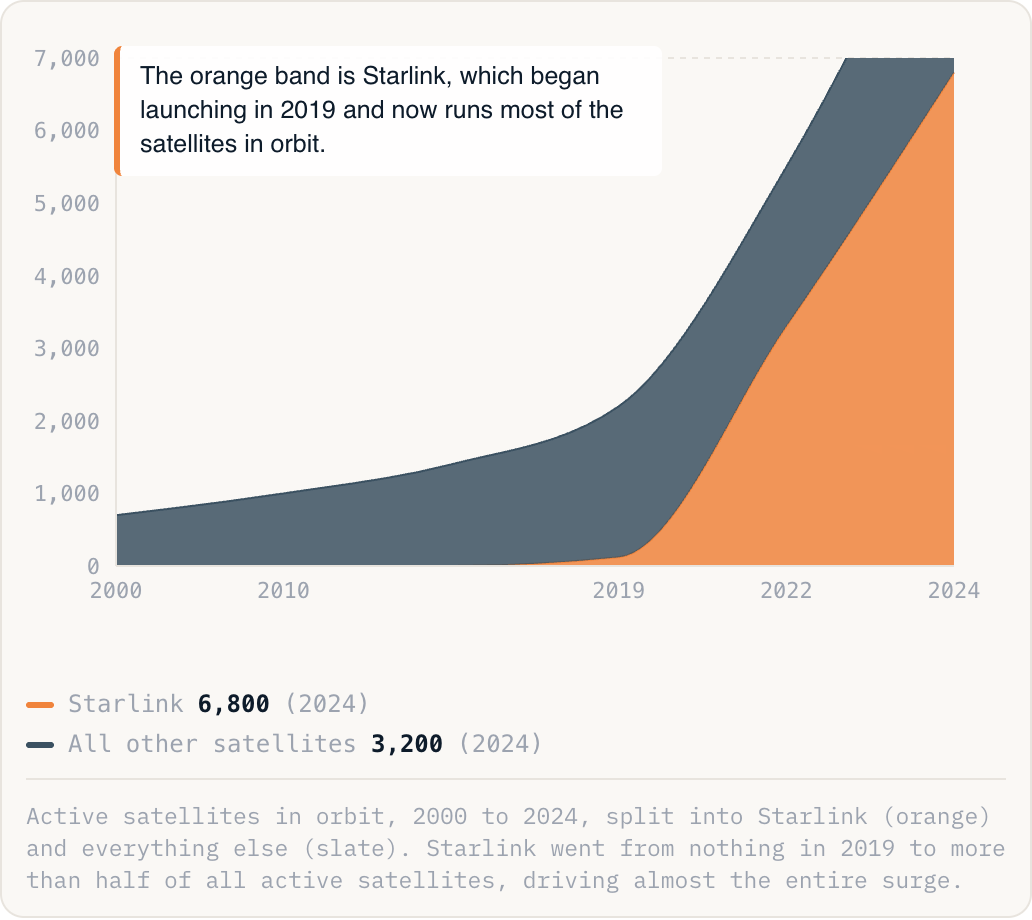
The orange band is Starlink, which began launching in 2019 and now runs most of the satellites in orbit.
Starlink6,800(2024)All other satellites3,200(2024)
Active satellites in orbit, 2000 to 2024, split into Starlink (orange) and everything else (slate). Starlink went from nothing in 2019 to more than half of all active satellites, driving almost the entire surge.
Why this is happening
- Reusable rockets cut the cost of reaching orbit so far that launching thousands of small satellites became affordable.
- Companies like SpaceX build whole networks at once, stacking dozens of satellites on each flight to beam internet down.
- Cheaper, smaller hardware means a single firm can put up more satellites in a year than the world managed in entire decades.
The take
Low orbit is filling fast, a new infrastructure land-grab over our heads led by Starlink. Whoever owns the orbits owns the connectivity, and the rules for crowding and collisions barely exist yet.