MacroSnaps24 August 2026
No. 44We work almost half as many hours a year as our great-grandparents did.
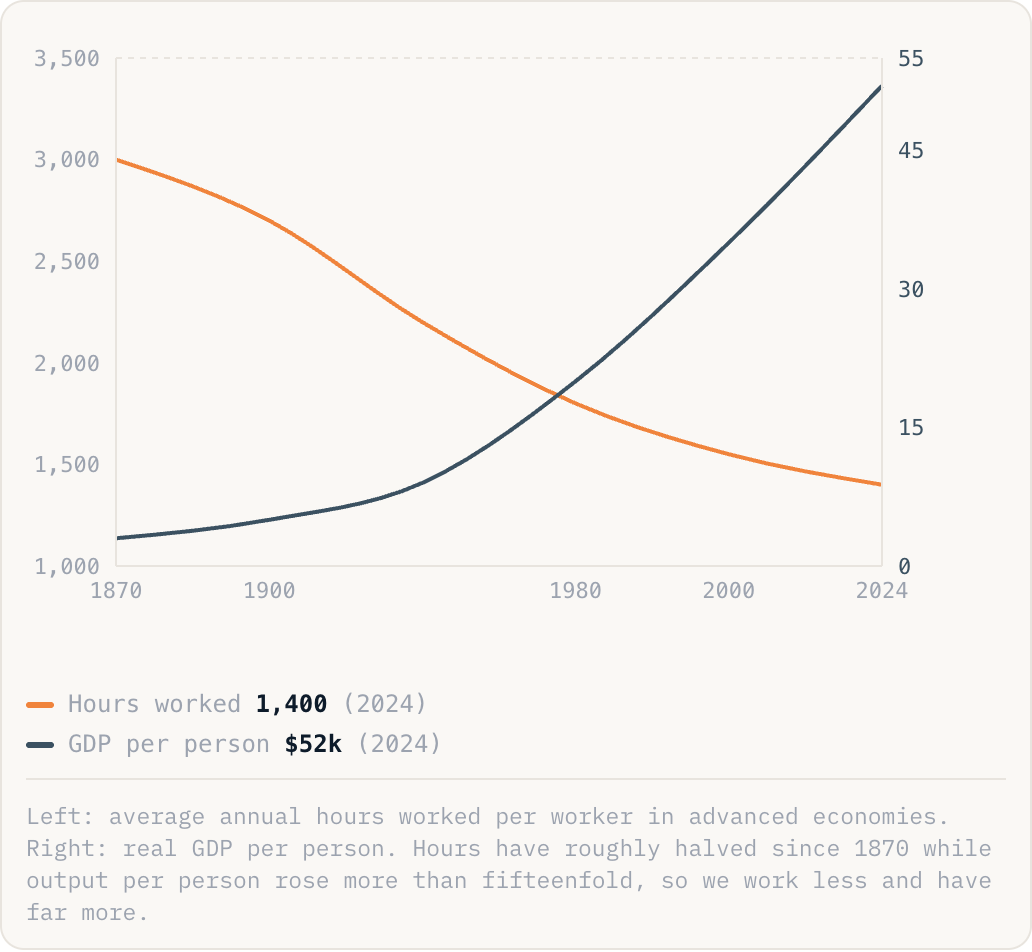
Hours worked1,400(2024)GDP per person$52k(2024)
Left: average annual hours worked per worker in advanced economies. Right: real GDP per person. Hours have roughly halved since 1870 while output per person rose more than fifteenfold, so we work less and have far more.
Why this is happening
- Rising productivity meant a worker could produce far more per hour, so the same output needed fewer hours and incomes could still climb.
- Workers and unions fought for and won the shorter week, the weekend and paid holidays, turning some of that productivity into time off rather than pay.
- The shift from farming and heavy industry to services, plus longer schooling at the start of life, trimmed the working year further.
The take
The real dividend of two centuries of growth was paid in leisure, not just in goods. We did not only get richer; we bought back great chunks of our own lives.