MacroSnaps11 July 2026
No. 06

The US is running a crisis-sized budget deficit, with no crisis.
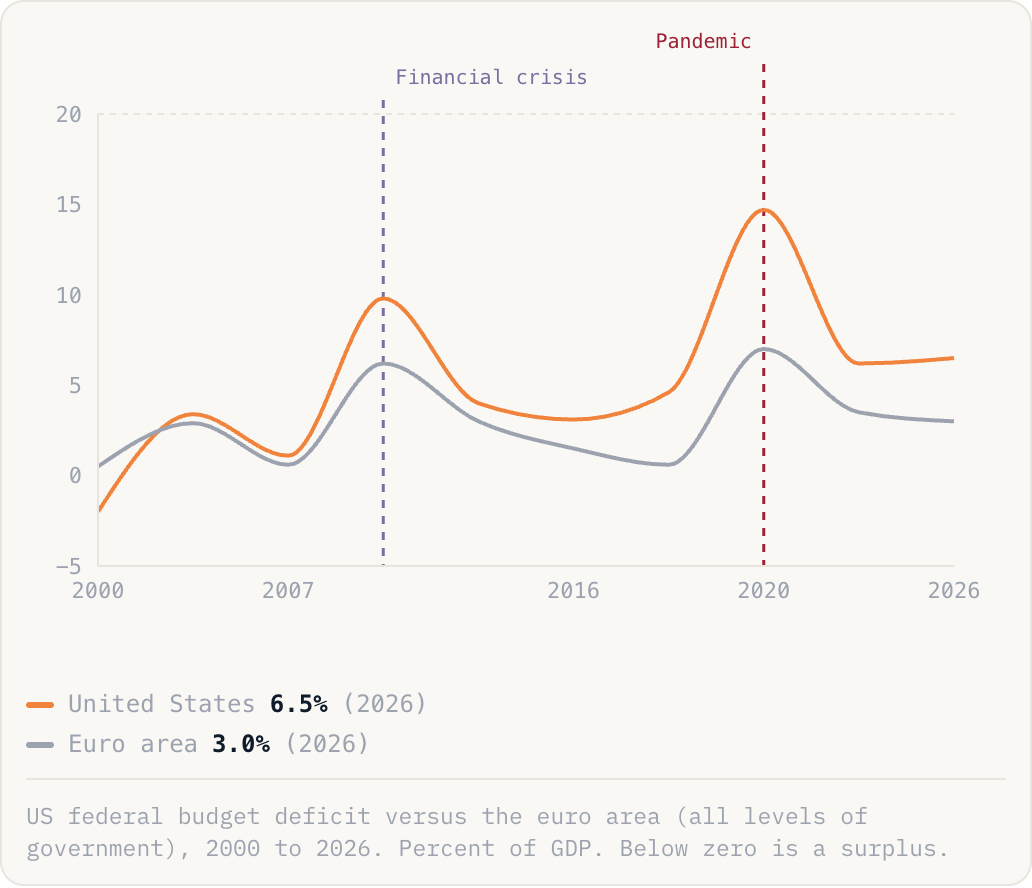
US federal budget deficit versus the euro area (all levels of government), 2000 to 2026. Percent of GDP. Below zero is a surplus.
United States6.5%(2026)Euro area3.0%(2026)

US federal budget deficit versus the euro area (all levels of government), 2000 to 2026. Percent of GDP. Below zero is a surplus.

Why this is happening
  • Both parties have raised spending and cut taxes, and neither will touch the big programmes that drive the gap.
  • Rising interest on the debt now piles on top of the regular shortfall.
  • Because the world keeps buying Treasuries, there is no market pressure forcing a fix, so the deficit just runs.
The take

Deficits this size used to be the emergency lever. Now they are the baseline, which means there is nothing held in reserve for when a real emergency arrives.

Money & debtmacrosnaps.app

Use this chart

Use this chart anywhere, including commercially, and change it if you need to. The one condition is that you credit MacroSnaps and link back to this page. Licence: Creative Commons Attribution 4.0 International (CC BY 4.0).

Embed it

A picture of the chart, linked back. Works anywhere, including in newsletters and Markdown. The credit line comes with it.

Cite it

Cites MacroSnaps for the chart. For the numbers themselves, cite the source below.

Permanent link: https://macrosnaps.app/c/us-deficit-anomaly

The underlying data

MacroSnaps drew this chart. The numbers in it are published by CBO, OMB (2026). Their terms, not ours, govern the underlying data.